

Pretiorates' Thoughts 72 – How sharp are the bears' claws?
Published on March 10th, 2025

In our analyses, we regularly examine current movements, identify possible influencing factors and assess the general market situation. However, these are not recommendations, but merely opinions and food for thought.
Dear readers!
Actually, we wanted to discuss a different topic today. The current movements in the stock markets are causing a great deal of uncertainty. Therefore, the US stock market will be discussed again in this issue.
Not so long ago, in Thoughts 58, we presented Eric Hadik's ominous 17-year cycle. Each of these cycles has been accompanied by a stock market correction of at least 20%. We are not there yet, but there are increasing signs that this new correction on Wall Street could take on a more significant meaning.
But no trend has no countermovements. This will also be the case with this sell-off. In fact, there are quite a few signs that Wall Street is ready for a strong recovery – with the emphasis on the word ‘recovery’.
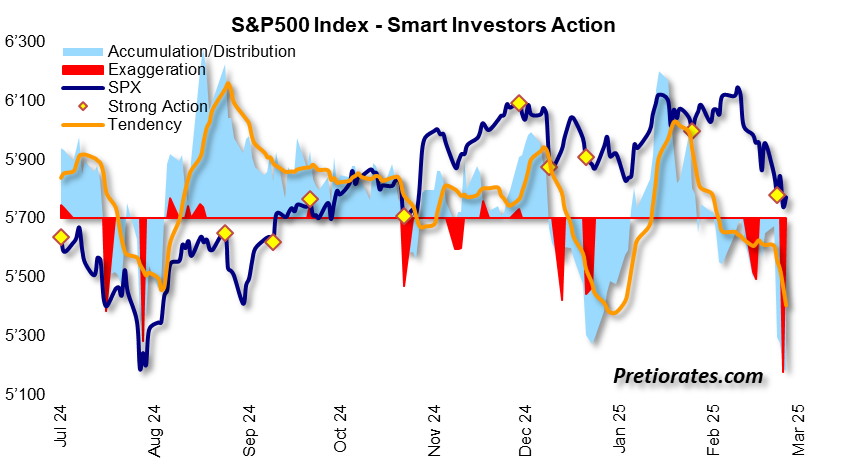
The Smart Investors Action indicator already shows a massive exaggeration (red area), which indicates a high level of emotion. In the meantime, it is even stronger than last August, when the bears last showed their claws...
An exaggeration of this magnitude usually results in a counter-reaction. What is still missing is the simultaneous generation of a yellow 'Strong Action' dot, which would significantly increase the chances of a recovery...
The sentiment indicator for optimism and pessimism has now fallen into negative territory, which is not entirely surprising. This is the time when bears find the most fish and honey around them. However, if pessimism becomes excessive, it is also when the important lows occur. The indicator has not fallen that far yet...

The Nasdaq market, with its many high-tech stocks, is actually a different market, which is why we are still keeping an eye on it. The 'Strong Action' is also pronounced here and a yellow 'Strong Action' dot is also missing. Therefore, a technical recovery is now possible, but it should remain so...

Of course, pessimism has now also taken over on the Nasdaq...

The S&P500 Fear Indicator has now also fallen into negative territory. However, fear is not yet particularly pronounced. For example, during last August's correction, it was much stronger...

Volatility calculates the fluctuations in the market and is expressed using the volatility index VIX. The stronger the fluctuations, the higher the emotions – which makes it an actual fear indicator.
The spot index reflects the current situation, while the six-month view is less affected by daily ups and downs and thus appears more serene. Wider spreads between the two indicate very interesting signals. Currently, it seems that fear is running a little high – and that a countermovement is likely...

The spread of the VIX index with its 50-day simple moving average is also interesting. The higher the difference, the more likely a countermovement is to be expected...

The skew index measures the cost of hedging a portfolio using long-term put options. Investors always try to hedge, but they are doing so more as a precaution than out of a possible fear of a correction. If the ratio between the skew and VIX index falls into negative territory, this is no longer the case. Then investors are willing to pay a high premium for hedging their portfolios. They usually only do this when emotions are particularly high.

The General Sentiment indicator takes even more inputs into account when defining the current sentiment. This has now also reached a level that usually brings a short-term, technical recovery...

Conclusion: Wall Street remains under massive bear pressure in the new week. Short-term sentiment has already reached a very pessimistic level. By the time everyone has become fearful, they have usually sold their positions. This reduces the selling pressure and makes it easier for the bulls to stage a countermovement. It would therefore not be surprising if a stronger recovery were to occur soon.
However, if one looks at the sentiment indicators from a longer-term perspective, a change in sentiment is only just beginning to emerge. The bears are therefore likely to continue to have their way for a little longer...
That’s it for today!
And don’t forget to recommend us - with the button below.
Remember, we are not making any recommendations for investments, we are just giving you ideas for your own analysis and decisions! Do your own due dilligence!
We wish you successful investments!
Pretiorates
If you like our short analysis, please recommend us to your friends!
Thank you for being a part of the Pretiorates community. Stay tuned for more updates, analyses, and deep dives into the realms of finance and economics.