


Pretiorates' Thoughts 79 – – When correlations crackle
Published on May 5th, 2025

In our analyses, we regularly examine current movements, identify possible influencing factors and assess the general market situation. However, these are not recommendations, but merely opinions and food for thought.
Dear readers,
Before we get to the new thoughts, check out the AI video from our last edition:
The markets still have their finger on the trigger
Please watch and give it a like! Or even better: subscribe to our AI channel!
Pretiorates’ Thoughts 79 – When correlations crackle
History repeats itself on the stock market – with astonishing regularity. The vast majority of investors behave in a similar way time and time again. No wonder, then, that experienced market observers talk about the notorious herd instinct. This has given rise to a form of technical analysis that has long been established in professional circles: fractal analysis. Past price movements are compared with current ones in the hope of identifying patterns that repeat themselves.
A particularly fascinating pattern is currently catching the eye: if you compare the S&P 500's performance since September 2022 with that from March 1996 to December 2000, you get a breathtaking correlation of +0.98. This correlation is almost uncanny. As a reminder, +1 means an identical movement, -1 would be a mirror image, and 0 means no correlation.
The big question, of course, remains: how long will this synchronized movement continue? The most honest answer is probably: as long as it lasts. If the pattern continues, the logical conclusion would be that the US stock market could be on a direct path to new all-time highs...

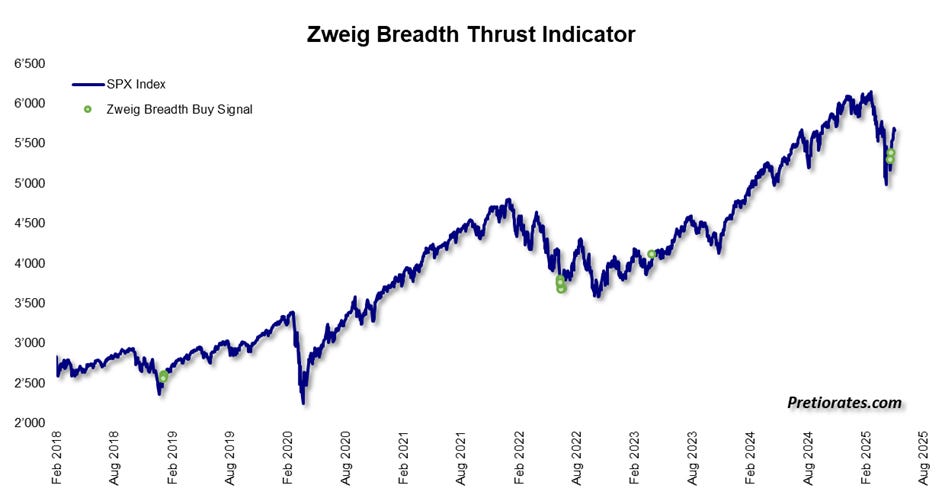
And indeed, some long-term indicators are now waving the bullish flag. Especially when an unusually large number of stocks hit new lows for the year, the market is often so oversold that a technical recovery – or even a medium-term rally – could be on the cards. As we are currently observing. In April, this indicator delivered a strong buy signal on two consecutive days...

The rare but proven two-breath-thrust indicator also recently gave a clear “buy” signal twice – a sign that should not be taken lightly...
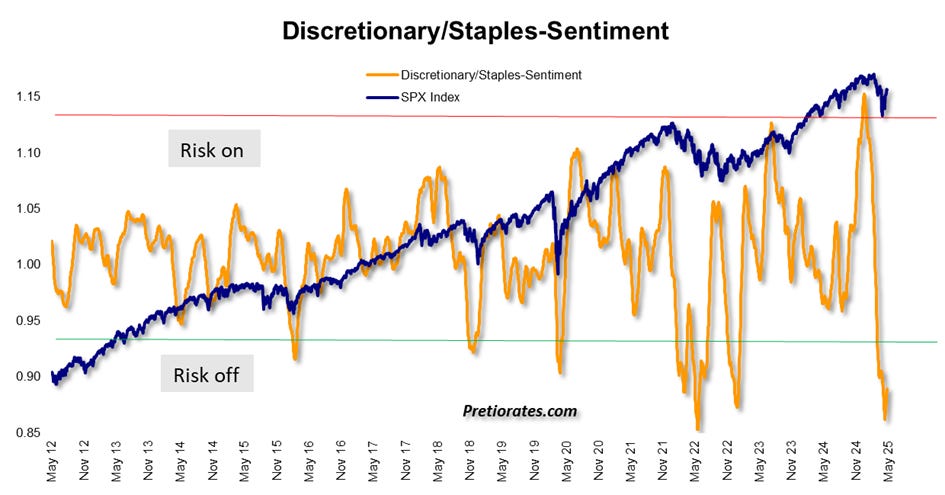
When investors seek defensive positions, there is usually a reason. Shares in non-cyclical companies that produce everyday necessities (staples) are then among the preferred investments. When the economy is strong, however, capital flows into cyclical consumer stocks (discretionaries), such as luxury goods or cars. The ratio of the two sectors is a very accurate indicator of whether investors are in a risk-on or risk-off mood. At the beginning of the year, this indicator was still bright red – now it is already at a historically low level. The message: sentiment is so poor that favorable entry opportunities could open up for long-term investors right now...
So while many long-term indicators point to sunshine, the short-term ones are looking rather frosty again: the General Sentiment Indicator, peppered with short-term sentiment inputs, is already back in overbought territory, which should urge traders to be cautious...

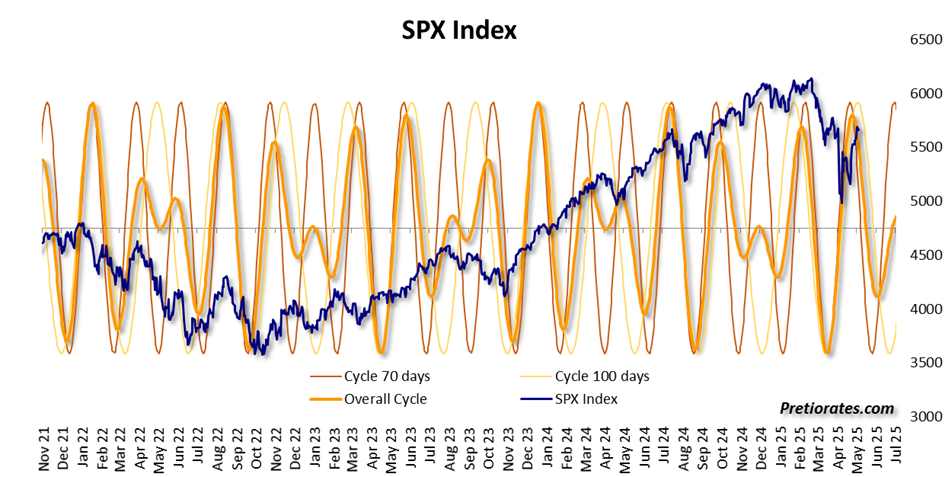
Particularly fascinating is the overarching cycle with its sub-cycles, which has predicted the highs with almost uncanny precision since the beginning of the year. It signals that the S&P 500 could take another hit in the coming weeks...
Such a setback would hardly be surprising, especially given the recent sharp drop in consumer confidence. The blame is likely to lie with Trump's new tariffs. And in an environment of such high correlations, many investors may be too heavily invested...

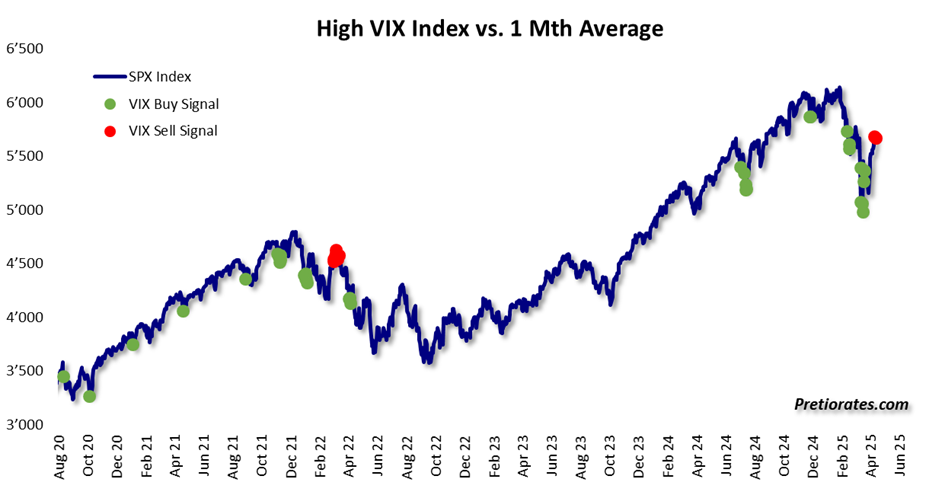
The VIX volatility index is also sounding the alarm: a fresh sell signal promises more turbulent times on the stock markets in the short term...
But anyone who thinks this is pure chart theory will also find fundamental evidence: a look at service inflation promises headwinds – prices are rising. This is a topic that has already been discussed several times in previous “Thoughts”. However, it is important to note that higher inflation is not necessarily bad for equities, but it does have a significant impact on Gold and – even more so – on the bond market...

Bottom Line: The indicator landscape for the coming days/weeks and months is showing two different sides. In the short term, the heart rate could rise again. But looking a little further ahead and after the possible setbacks, the stock markets could return to a sustained bullish trend.
We wish you successful investments!
Yours sincerely,
Pretiorates
These thoughts will be available as an AI video on Youtube.com within 48 hours: https://www.youtube.com/@Pretiorates
And don’t forget to recommend us - with the button below.
Remember, we are not making any recommendations for investments, we are just giving you ideas for your own analysis and decisions! Do your own due dilligence!
If you like our short analysis, please recommend us to your friends!
Thank you for being a part of the Pretiorates community. Stay tuned for more updates, analyses, and deep dives into the realms of finance and economics.