In our analyses, we regularly examine current movements, identify possible influencing factors and assess the general market situation. However, these are not recommendations, but merely opinions and food for thought.
Hello dear readers!
The FED continues to operate a QT (blue line), the FED balance sheet continues to decline...
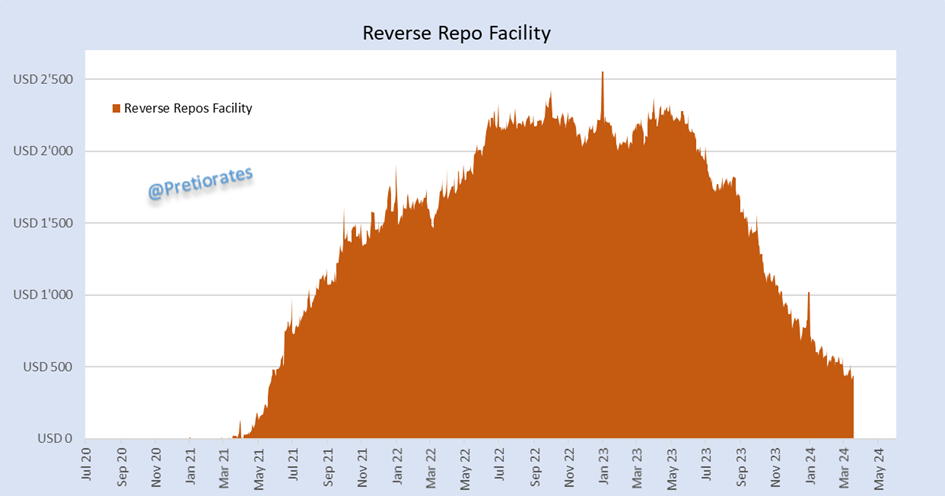
So far, this has been possible despite the new, massive debt. The liquidity required for this has so far come from the reverse repo facility. In the meantime, this source has fallen from USD 2500 billion to less than USD 500 billion and is now drying up. Will the Fed therefore announce an end to the QT tomorrow?
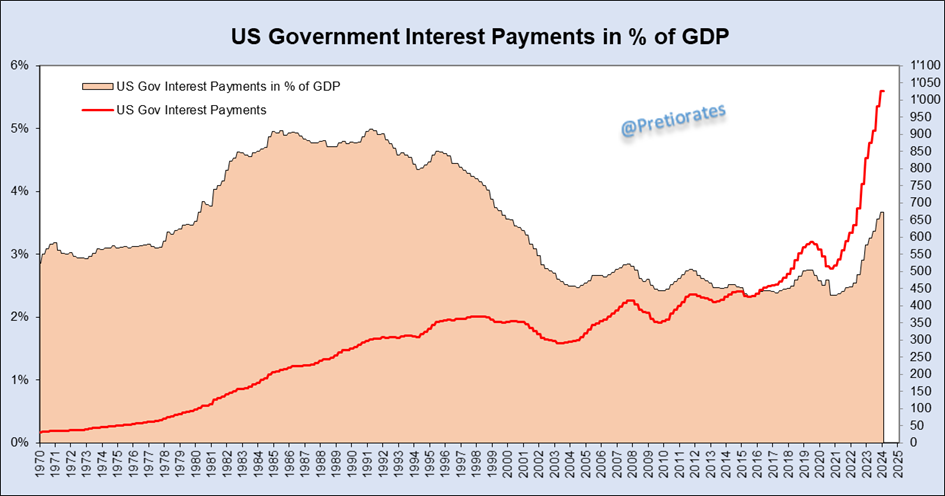
This does little to put the new debt into perspective: compared to the 1980s, the US government is paying massively more interest on its debt. Compared to GDP, however, it is still clearly lower today...
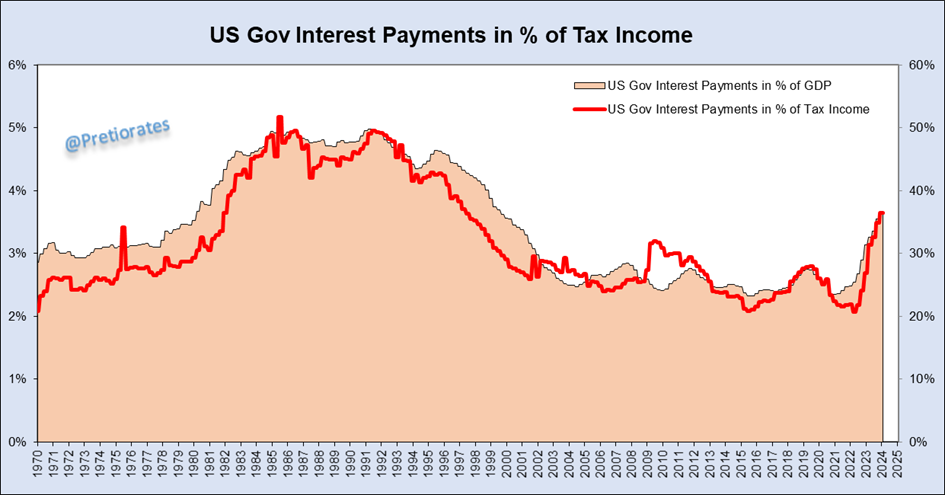
Even in relative comparison to tax revenues, the US state pays significantly less than it did nearly four decades ago, despite its much higher debt...
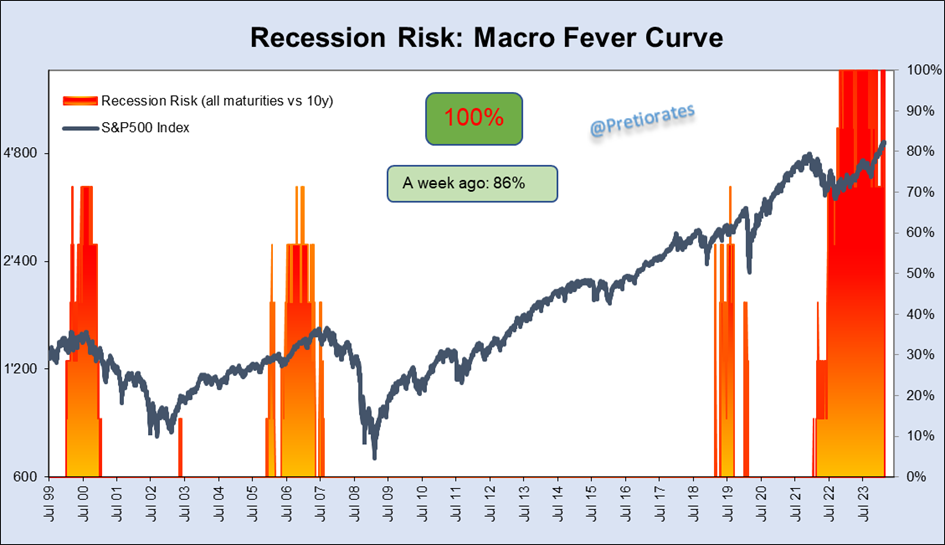
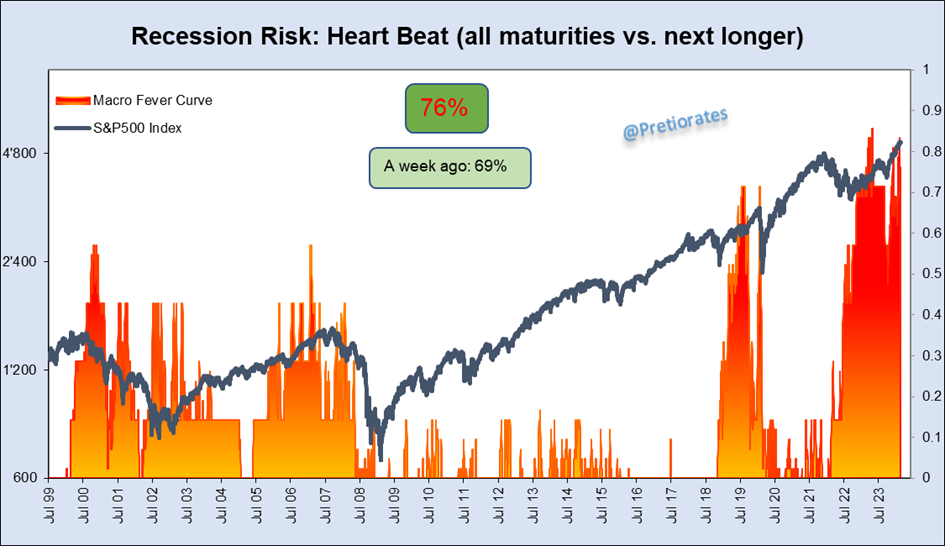
The recession indicator, the ‘Macro Fever Curve’, recently rose from 86 % to 100 % again...
The ‘Heart Beat’ also rose again from 69% to 76% probability of a coming recession...
The market capitalization of the Nasdaq 100 has now exceeded the 20000 billion mark. The market capitalization of the ‘Magnificent Seven’ continues to help, even if there are only the ‘Magnificent Four’ left. However, the percentage share of the total capitalization of the Nasdaq 100 Index has not been rising for some time...
The broad S&P500 index has now moved away from the 200-day line to a level where in the past the fatigue of the bulls could be felt...
The correlation of hedge funds with the S&P500 index tells us that they have been over-invested in the equity market for some time...
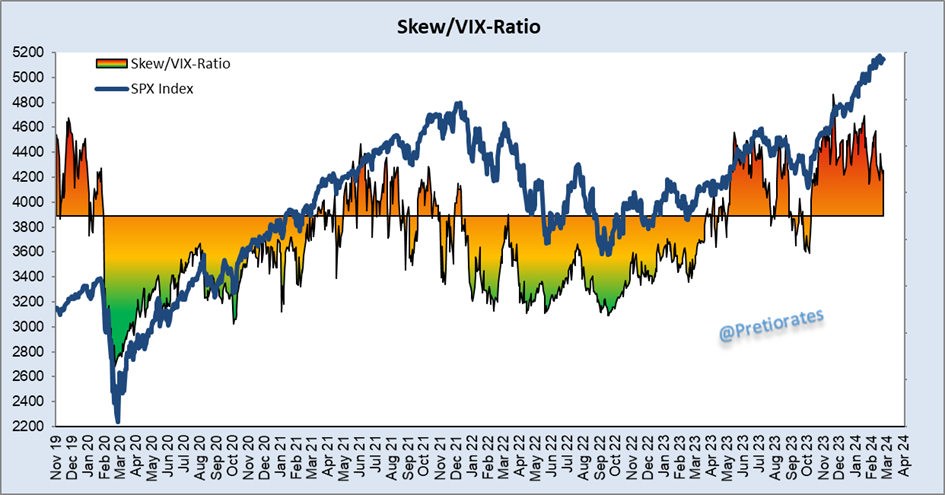
Fear or caution is usually the ‘fodder’ for further advances. Bull markets die when bulls are fully invested. The skew/VIX ratio tells us that this could happen soon. Often a moment when the bears launch their next attack...
Not entirely serious: the bears have the template for a massive attack... The correlation between 1929 and 2024 currently is a high 90%, but the chart only works as long as it works...
The Smart/Dumb-Action on the S&P500 Index is nearing to the negative zone. An indication that the big investors are distributing...
That’s it for today!
Remember, we are not making any recommendations for investments, we are just giving you ideas for your own analysis and decisions! Do your own due dilligence!
We wish you successful investments!
Pretiorates
Thank you for being a part of the Pretiorates community. Stay tuned for more updates, analyses, and deep dives into the realms of finance and economics.


